Tsunami Risk & Preparation
-
1Vashon's Tsunami RiskWhat causes tsunamis and who on Vashon is at risk?
-
2
-
3Surviving a tsunamiGo uphill, but then what?
Tsunami risk mostly affects waterfront homes and commmunities, but on Vashon, that is a high percentage of our households, and damage to our ferry docks would impact the entire island.
Earthquakes both local and far away can generate tsunamis that affect Puget Sound. Learning about the risks and how to react when a tsunami is coming can save lives and property.

Undersea Quakes: The two sides of a fault rub against one another during a quake, shoving the earth’s tectonic plates up or down. That uplifting movement displaces huge volumes of water, thus generating a tsunami wave. (iStock illustration)
Step 1
What Causes Tsunamis?
With a few exceptions, tsunamis are generated by earthquakes under or very near the ocean. Underwater landslides or volcanic eruptions may also cause tsunamis. Earth movement from these events can push water into a wave that moves very fast across the water, building to a towering wave as it approaches land and crashes on shore.

Pacific Ring of Fire
The red stars in this infographic mark major volcanoes on the Pacific Ring of Fire. Much of the world’s earthquake activity happens around this seismically active region. That’s why 80% to 90% of all tsunamis happen along the Pacific coasts. (iStock illustration)
Vashon's Tsunami Risk
Vashon Island’s primary earthquake risk includes three major fault zones — the Tacoma Fault, the Seattle Fault, and the Cascadia Subduction Zone (Cascadia). All three of these fault systems could generate catastrophic tsunamis on Vashon. A Washington Department of Natural Resources study released in 2022, predicted the Cascadia fault would initially cause only a ripple in Puget Sound. However, the study predicts the water ripple could build up in Tacoma’s Commencement Bay and slosh back through the Sound within a few hours of the initial quake, causing tsunami waves on the Vashon shorelines as high as 9 to 16 feet. Quakes on the Seattle and Tacoma fault systems could also cause damaging tsunami waves on the Vashon shoreline, and these waves would arrive with very little warning almost immediately after the quake. You can learn more about earthquake risks for Vashon on our earthquake hazard page.

Step 2
Preparing in Advance for a Tsunami
- Figure out whether you are in a tsunami hazard area. Is your home at least 100 feet above sea level?
- Discuss the tsunami risk with members of your household and create an emergency plan, including the way you will communicate after a tsunami, just as you would for any other hazard such as earthquake or wildfire.
- Your plan should include walkable routes for reaching higher ground and further inland. Practice walking them to make them familiar before you face the chaos of a major emergency.
- Sign up for emergency alerts. You’ll want to have multiple ways to get alerts. We have listed some on this page under Where to Get More Information.
- Take all the steps we list on our earthquake hazard page, including gathering of supplies and making up go bags.
- Organize important documents and store copies electronically. Take an inventory of your home to help you recover after a disaster.

Walk, Don’t Drive: Generally, walk to higher ground if you are trying to get safe from a tsunami. If you attempt to evacuate in a car, you may get nowhere due to traffic jams. Also, you will be tempted to put precious items in your vehicle, which would slow you down. Every second counts. (FEMA photo)
Step 3
Surviving a Tsunami
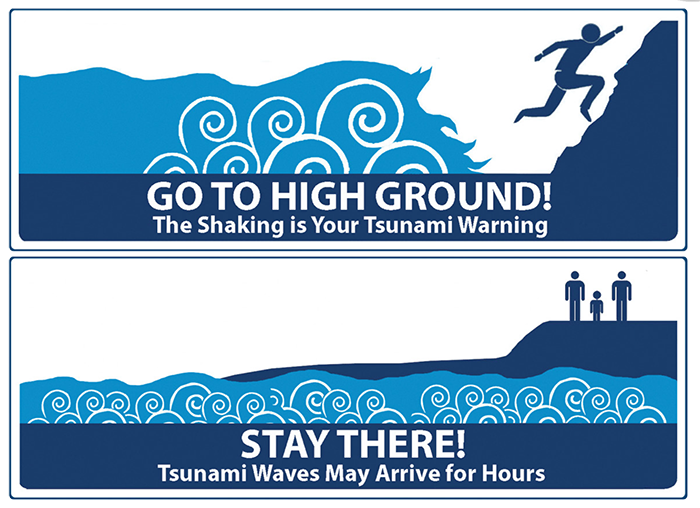
Know this: If you feel a strong earthquake lasting 20 seconds or longer, get to higher ground immediately!
- First, protect yourself from the earthquake. Drop, cover, and hold on. Wait until the shaking stops before evacuating.
- Then, get to high ground as far inland as possible. Be alert to signs of a tsunami, such as a sudden rise or draining of ocean or sound waters.
- If you can’t walk out, climb on top of a building to get higher, above the incoming wave.
- Listen to emergency information and alerts. Always follow the instructions from local emergency managers.
- DO NOT WAIT to evacuate! Leave as soon as you see any signs of a tsunami or receive an official warning.
- Stay away from the tsunami area until you receive an official all-clear. Tsunamis almost always come in multiple waves, the first wave typically is not the largest and won’t be the last one.
Get More Information
Washington State Tsunami information: https://www.dnr.wa.gov/programs-and-services/geology/geologic-hazards/tsunamis
NOAA National Weather Service (NWS) Tsunami page: https://tsunami.gov
NWS TsunamiReady: https://www.weather.gov/tsunamiready
Video simulation of tsunami waves in Washington State. Shows the southern part of the island particularly impacted by water sloshing back from Tacoma, and Quartermaster Harbor suffering repeated waves.
